
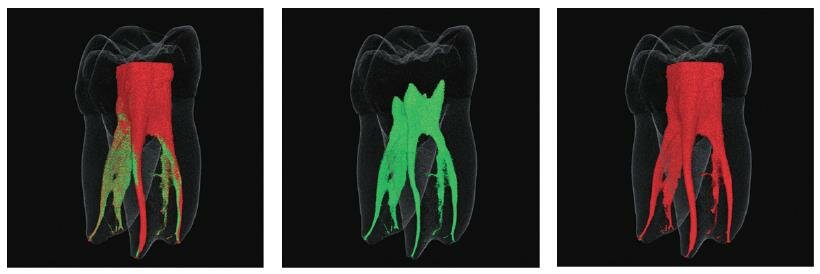
Imaging is only the first step in a dental imaging study. The scientific value of imaging data often comes from the ability to accurately identify, segment, measure, and quantify the structures of interest.
At KARA, we provide image processing and quantitative analysis services for dental research, with a focus on extracting meaningful structural and morphological information from Micro-CT and other imaging datasets.
Depending on the research objectives, our analysis workflows may include image preprocessing, segmentation, three-dimensional reconstruction, morphometric measurements, mineral density analysis, and quantitative data extraction.
Our Image Analysis Workflow
Image Optimization
Qualitative Image Processing
Quantitative Image Analysis
Segmentation & 3D Visualization
Research Report Preparation
STEP 1
Image Optimization & Artifact Correction
 Improving Image Quality for Reliable Analysis
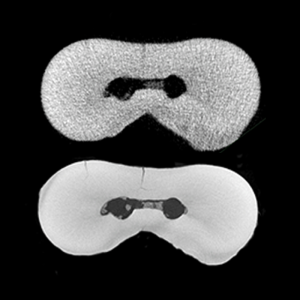
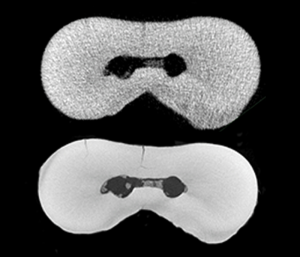
Imaging artifacts and variations in image quality can affect both visual interpretation and quantitative measurements. Image processing techniques can be applied to reduce unwanted artifacts and optimize datasets for subsequent analysis.
Possible processing steps include:
- Artifact reduction and correction
- Noise reduction
- Contrast enhancement
- Intensity normalization
- Image filtering
- Correction of non-uniformities and unwanted variations
STEP 2
Qualitative Image Processing & 2D Visualization
Visualizing Dental Structures in Two Dimensions
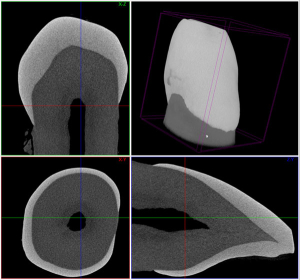
Qualitative image processing focuses on improving the visual representation of imaging data and highlighting structures of interest. Processed 2D images can be used for visual assessment, comparison between experimental groups, and presentation of research findings.
Possible outputs include:
- 2D image visualization
- Cross-sectional image presentation
- Region of Interest visualization
- Contrast-enhanced images
- Comparison of experimental groups
- Annotated images for research presentations
STEP 3
Quantitative Image Analysis
Converting Images into Quantitative Data

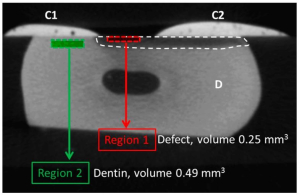
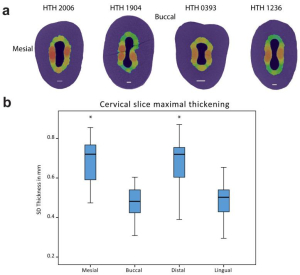
Quantitative image analysis transforms visual information into measurable data that can be used for objective comparison between samples or experimental groups. Depending on the imaging modality and study design, a range of structural, morphological, and density-related parameters can be extracted.
Potential quantitative parameters include:
- Volume and surface area
- Thickness and diameter
- Mineral density
- Lesion depth and volume
- Porosity and pore characteristics
- Bone volume and bone density
- Trabecular parameters
- Root canal volume and morphology
- Structural and morphometric parameters
Quantitative measurements can be extracted from selected Regions of Interest and organized for subsequent statistical analysis
STEP 4
Segmentation, Color-Coded Visualization & Research Videos
Creating Publication- and Presentation-Ready Visualizations
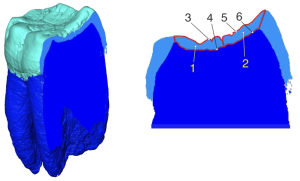
Segmentation and three-dimensional visualization can help researchers clearly demonstrate anatomical structures, tissue boundaries, and regions of interest. Color-coded 2D and 3D visualizations, as well as research videos, can be prepared for scientific publications, presentations, and research communication.
Possible outputs include:
- Color-coded segmented images
- 2D and 3D visualizations
- Segmented anatomical structures
- 3D reconstructed models
- Rotating 3D videos
- Before-and-after visual comparisons
- Figures for scientific publications and presentations
STEP 5
Research Report Preparation
Organizing Image Analysis Results into a Research Report
Image analysis results can be organized into structured research reports that clearly present the analysis workflow, methodology, quantitative findings, and visual outputs. Reports can be tailored to the specific objectives of the research project and used to support further statistical analysis, manuscript preparation, or scientific presentations.
A research report may include:
- Imaging and analysis methodology
- Image processing workflow
- Representative 2D and 3D images
- Segmentation results
- Quantitative measurements
- Tables and graphs
- Comparison between experimental groups
- Summary of key findings